Community-engaged information design (GEOG 2115, Spring 2023)
Project completed by Yolanda C. Lin with funding from the Center for Community Geography. The following was written by Dr. Lin.
Information Design for Science and Society (GEOG 2115) is a lower division geography course that is part of the university general education curriculum in the communication group. This relatively new course was first offered in Spring 2022, and will be continued to be offered each spring. In this course, students learn the basics of visual information and data design within the context of science and society. In this project-based course, with support from the Center for Community Geography, students developed a set of data-driven infographics for our community partners, the Albuquerque City Nature Challenge. These were then shared on social media through the Albuquerque City Nature Challenge accounts on Twitter, Facebook, and Instagram in the week leading up to the competition (e.g., https://twitter.com/ABQcitynature/status/1651395235384008706).
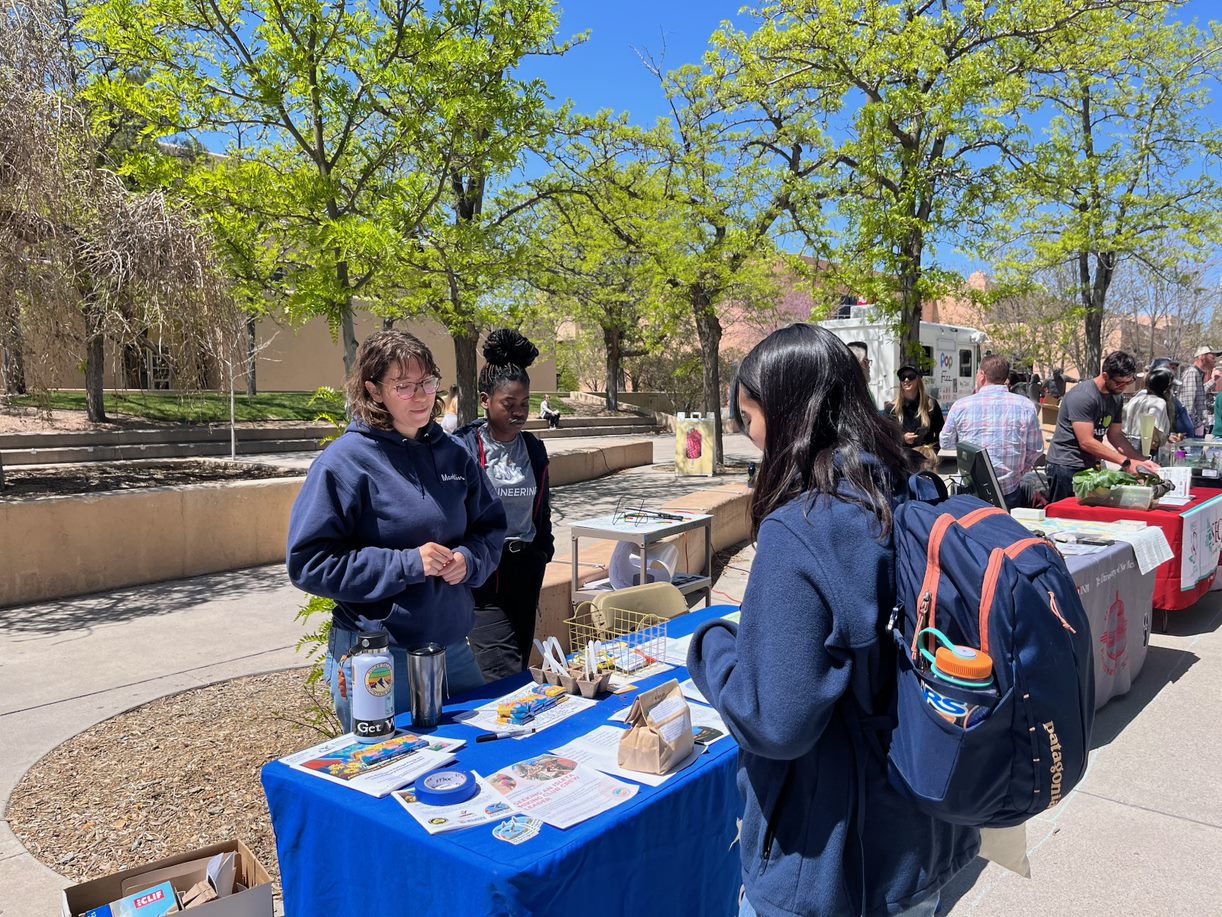
Funding from this grant also supported two booths leading up to the competition, one on April 20 as part of the Sustainability Expo and another on April 28 on the first day of the competition. The booths featured the infographics developed by students, and student volunteers handed out granola bars that had information on how to join the competition, as well as ABQ CNC stickers. This project is one of four projects that students complete during the course of the semester. This project is the main focus on Module 2/Project 2: Information Design is Local: Creating Infographics for the ABQ CNC.
The support from the Center for Community Geography is extremely valuable to the students in this class (43 students enrolled at the 3 week point) to feel that their work is relevant and has a greater purpose beyond the class or their grade. Many students also expressed enthusiasm for having the opportunity to get involved in this community effort. At the end of the semester, I asked for students to reflect on which project they enjoyed the most. One student response read: “Out of the four modules, I enjoyed module 2 [Information Design is Local: Creating Infographics for the ABQ CNC] the most. It was really interesting to learn about the city nature challenge and how it can help the local community as well as help us learn more about the natural world and the species that inhabit it. I had the most fun designing the graphic for this module, and learning how to manipulate the dataset in Excel was a very good learning opportunity.”
This collaboration has also been valuable to our community partner, the ABQ CNC organizers. Upon receiving the infographics from this year’s students, Laurel Ladwig shared with me via email, “These are so great!” and Selena Connealy replied, “Oh wow, these are amazing! My favorite is "Want to be better than Texas?”

I look forward to collaborating with ABQ CNC and the Center for Community Geography in the future, and I am grateful for the Center for Community Geography’s support in making this community-engaged classroom a possibility for the students of GEOG 2115.
Graphic created by one of Dr. Lin's Spring 2023 GEOG 2115 students, Kyreen.
